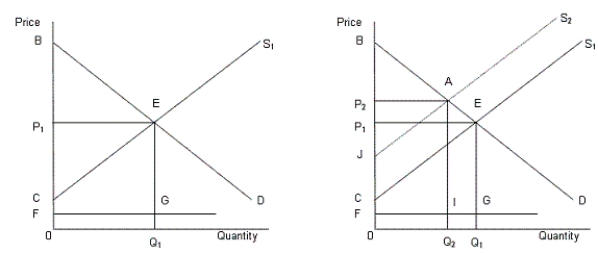
In the following figure, the first panel shows a market situation prior to regulation and the second panel shows the effects of regulation.Figure 14.2
 In the figure,
D: Demand curve for automobiles
S1: Supply curve of automobiles prior to regulation
S2: Supply curve of automobiles after regulation
FG: Clean up cost per unit
-The marginal factor cost (MFC) is the:
A) value of the additional output that an extra unit of a resource can produce.
B) additional cost of employing an additional unit of a resource.
C) additional cost of producing an additional unit of output.
D) the ratio of the total fixed cost to the total cost of production.
E) ratio of total cost to the total amount of resources employed.
Correct Answer:
Verified
Q10: In the following figure, the first panel
Q11: In the following figure, the first panel
Q12: In the following figure, the first panel
Q13: In the following figure, the first panel
Q14: In the following figure, the first panel
Q16: In the following figure, the first panel
Q17: In the following figure, the first panel
Q18: Analysis
The following figure shows the marginal revenue
Q19: In the following figure, the first panel
Q20: In the following figure, the first panel
Unlock this Answer For Free Now!
View this answer and more for free by performing one of the following actions

Scan the QR code to install the App and get 2 free unlocks

Unlock quizzes for free by uploading documents