The figure given below represents the marginal revenue product (MRP) and the marginal factor cost (MFC) of a resource in the resource market. Figure 14.3 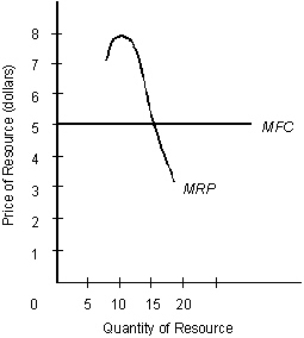 Consider the resource market shown in Figure 14.3.Given that the resource market is perfectly competitive,determine the equilibrium price of the resource.
A) $8
B) $3
C) $5
D) $4
E) Cannot be determined from the information given
Correct Answer:
Verified
Q1: In the following figure, the first panel
Q4: In the following figure, the first panel
Q12: In the following figure, the first panel
Q17: Firms are consumers and households are the
Q20: Which of the following statements best illustrates
Q22: The following table shows output per hour
Q23: The following figure shows the marginal revenue
Q24: The figure given below shows the marginal
Q25: After hiring 151 units of the variable
Q26: The following table shows the total output
Unlock this Answer For Free Now!
View this answer and more for free by performing one of the following actions

Scan the QR code to install the App and get 2 free unlocks

Unlock quizzes for free by uploading documents