The figure given below represents equilibrium in the labor market with the demand and supply curves of labor. Figure 14.6 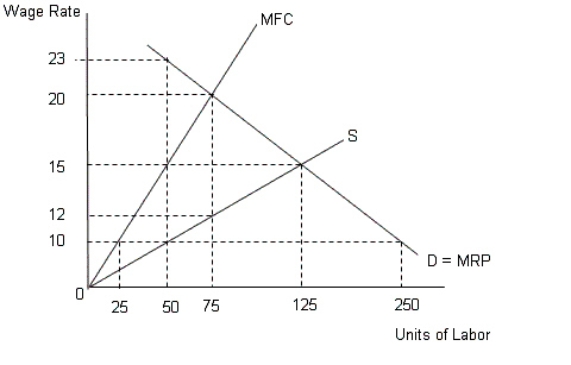 In the figure,
D = MRP implies demand for labor = Marginal Revenue Product
MFC represents Marginal Factor Cost curve
S represents the supply curve of labor
According to Figure 14.6,what is the wage paid by a monopsonist?
A) $10
B) $23
C) $20
D) $12
E) $15
Correct Answer:
Verified
Q66: Why is the value of marginal product
Q66: The figure given below represents equilibrium in
Q67: The figure given below represents equilibrium in
Q69: The figure given below represents equilibrium in
Q71: The figure given below represents equilibrium in
Q73: If an individual thinks about how he
Q74: If a resource has perfectly elastic supply
Q77: The figure given below represents equilibrium in
Q79: The figure given below represents equilibrium in
Q80: The figure given below represents equilibrium in
Unlock this Answer For Free Now!
View this answer and more for free by performing one of the following actions

Scan the QR code to install the App and get 2 free unlocks

Unlock quizzes for free by uploading documents