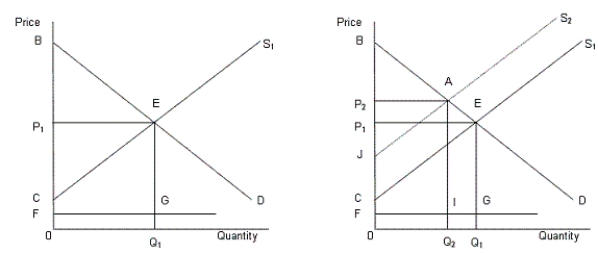
In the following figure, the first panel shows a market situation prior to regulation and the second panel shows the effects of regulation.Figure 14.2
 In the figure,
D: Demand curve for automobiles
S1: Supply curve of automobiles prior to regulation
S2: Supply curve of automobiles after regulation
FG: Clean up cost per unit
-Although the GATT was supported by most of the countries of the world, yet global trade shrank during the close of the last decade. This was due to:
A) growing suspicion among the nations of the world.
B) hyperinflation in the major economies of the world.
C) the recession which began in 2007.
D) political turmoil in the Asian countries.
E) the desire among the major players to dominate the international market.
Correct Answer:
Verified
Q75: In the following figure, the first panel
Q76: In the following figure, the first panel
Q77: In the following figure, the first panel
Q78: In the following figure, the first panel
Q79: In the following figure, the first panel
Q81: In the following figure, the first panel
Q82: In the following figure, the first panel
Q83: In the following figure, the first panel
Q84: In the following figure, the first panel
Q85: In the following figure, the first panel
Unlock this Answer For Free Now!
View this answer and more for free by performing one of the following actions

Scan the QR code to install the App and get 2 free unlocks

Unlock quizzes for free by uploading documents