The table below shows the payoff (profit) matrix of Firm A and Firm B indicating the profit outcome that corresponds to each firm's pricing strategy (where $500 and $200 are the pricing strategies of two firms) . Table 11.2 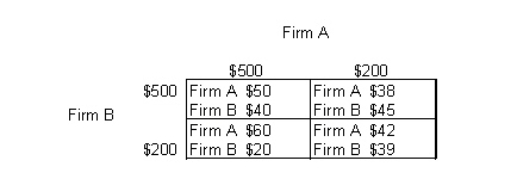
-Refer to Table 11.2.If firm both firm A and firm B choose their dominant strategies then:
A) firm A makes a profit of $40 and firm B makes a profit of $45.
B) firm A makes a profit of $50 and firm B makes a profit of $45.
C) firm A makes a profit of $50 and firm B makes a profit of $40.
D) firm A makes a profit of $42 and firm B makes a profit of $40.
E) firm A makes a profit of $40 and firm B makes a profit of $20.
Correct Answer:
Verified
Q61: The table below shows the payoff (profit)
Q67: The following table shows the payoff matrix
Q70: The following table shows the payoff matrix
Q72: Which of the following is an example
Q73: Which of the following statements about collusion
Q73: The table below shows the payoff (profit)
Q77: The condition under which a cartel can
Q78: An efficient way to move toward the
Q79: The table below shows the payoff (profit)
Q81: Consumers who purchase brand-name pharmaceuticals because they
Unlock this Answer For Free Now!
View this answer and more for free by performing one of the following actions

Scan the QR code to install the App and get 2 free unlocks

Unlock quizzes for free by uploading documents