The figure given below shows the demand curve faced by a firm. Figure 10.1 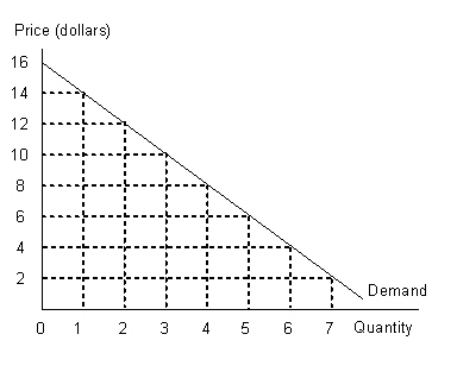 Refer to Figure 10.1 and calculate the revenue gained by the firm when it reduces the price of its product from $8 to $4.
A) $4
B) $8
C) $32
D) $16
E) $10
Correct Answer:
Verified
Q1: The figure given below shows the aggregate
Q13: The figure given below shows the aggregate
Q18: Before World War II,Alcoa controlled the supply
Q20: Perfect competition provides one model in which
Q21: The table given below shows the price
Q23: For a monopolist with a linear demand
Q24: The table given below shows the prices
Q25: The figures given below represent the revenue
Q27: The table given below shows the prices
Q38: The figures given below represent the revenue
Unlock this Answer For Free Now!
View this answer and more for free by performing one of the following actions

Scan the QR code to install the App and get 2 free unlocks

Unlock quizzes for free by uploading documents