The following figures show the demand and cost curves of a perfectly competitive and a monopoly firm respectively. Figure 10.7 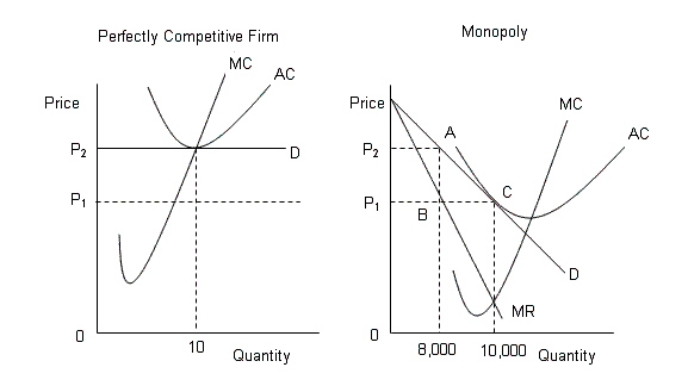
D: Average Revenue
AC: Average cost
MC: Marginal cost
MR: Marginal cost
-Calculate the deadweight loss in Figure 10.7,if the perfectly competitive industry is monopolized after it had been producing an output of 10,000 units?
A) The area P2ACP1
B) The area ABC
C) The area P2ABP1
D) The distance AB
E) There is no deadweight loss
Correct Answer:
Verified
Q62: The following figures show the demand and
Q63: The figure below shows the market equilibrium
Q64: Movie theaters are able to offer discounts
Q65: Perfect price discrimination occurs when:
A)each customer is
Q68: The following figure shows the revenue curves
Q69: The figure below shows the market equilibrium
Q69: The following table shows the marginal revenues
Q70: The efficiency loss that occurs when a
Q72: The following figure shows the revenue curves
Q74: The figure given below shows the demand
Unlock this Answer For Free Now!
View this answer and more for free by performing one of the following actions

Scan the QR code to install the App and get 2 free unlocks

Unlock quizzes for free by uploading documents