The figure given below shows the demand and cost curves of a perfectly competitive firm. Figure: 9.4 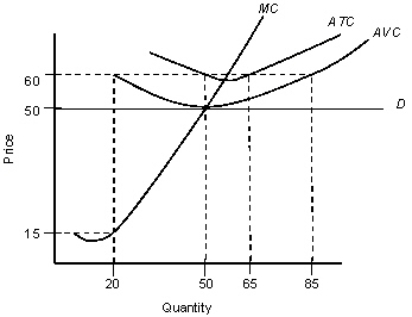
D: Demand curve
MC: Marginal cost curve
ATC: Average-total cost curve
AVC: Average-variable-cost curve
-Refer to Figure 9.4.The total profit or loss for the firm is:
A) $500 profit.
B) $2,500 profit.
C) $2,500 loss.
D) $650 loss.
E) $500 loss.
Correct Answer:
Verified
Q68: The figure given below shows the revenue
Q70: The figure given below shows the demand
Q73: The figure given below shows the revenue
Q74: A firm should not necessarily shut down
Q76: Since the beginning of the millennium,the United
Q76: The figure given below shows the revenue
Q79: In the short run a competitive firm
Q80: If a firm in a perfectly competitive
Q81: On August 5,2003,a tragic fire destroyed a
Q82: The following figure shows equilibrium at the
Unlock this Answer For Free Now!
View this answer and more for free by performing one of the following actions

Scan the QR code to install the App and get 2 free unlocks

Unlock quizzes for free by uploading documents