The figure given below shows the revenue and cost curves of a perfectly competitive firm. Figure 9.5 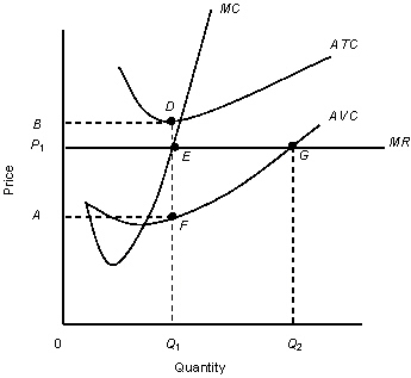
MC: Marginal cost curve
MR: Marginal revenue curve.
ATC: Average-total-cost curve
AVC: Average-variable-cost curve
-According to Figure 9.5,the firm has:
A) profits equal to the area AP1EF.
B) profits equal to the area P1BDE.
C) losses equal to the area 0AFQ1.
D) losses equal to the area P1BDE.
E) no profit no loss.
Correct Answer:
Verified
Q58: The figure given below shows the revenue
Q59: At an output level above the profit-maximizing
Q60: The figure given below shows the revenue
Q61: The figure given below shows the revenue
Q62: The figure given below shows the demand
Q64: The figure given below shows the revenue
Q65: The figure given below shows the demand
Q67: When revenue is less than total cost
Q72: The figure given below shows the revenue
Q74: The figure given below shows the revenue
Unlock this Answer For Free Now!
View this answer and more for free by performing one of the following actions

Scan the QR code to install the App and get 2 free unlocks

Unlock quizzes for free by uploading documents