The following figure shows equilibrium at the industry and firm level. Figure 9.6 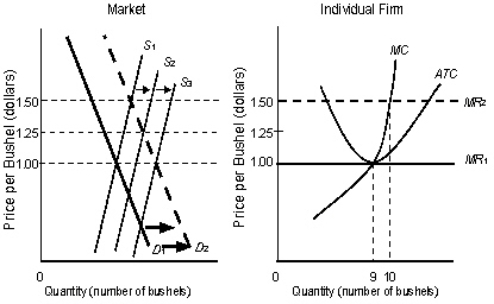
In the figure,
S1,S2,S3 are the market supply curves.
D1 and D2 are the market demand curves.
MC is the marginal cost curve of the firm.
MR1 and MR2 are the marginal revenue curves of the firm.
ATC is the average-total-cost curve of the firm.
-According to Figure 9.6,if the market price was $1.50,the individual firm would:
A) be earning a negative economic profit of about $5.
B) be earning a positive economic profit of about $5.
C) be earning a positive economic profit of about $0.87.
D) be earning a negative economic profit of about $4.50.
E) be earning a positive economic profit of about $0.50.
Correct Answer:
Verified
Q81: The figure given below shows the revenue
Q83: The figure given below shows the revenue
Q84: When firms leave a perfectly competitive market,then,other
Q85: The following figure shows equilibrium at the
Q87: The figure given below shows the revenue
Q89: From a social viewpoint,when price = marginal
Q90: Above-normal profits earned by existing firms in
Q91: The following figure shows equilibrium at the
Q93: The following figure shows equilibrium at the
Q97: The following figure shows equilibrium at the
Unlock this Answer For Free Now!
View this answer and more for free by performing one of the following actions

Scan the QR code to install the App and get 2 free unlocks

Unlock quizzes for free by uploading documents