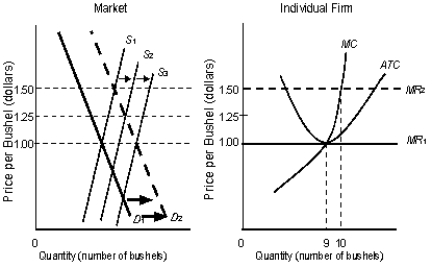
The following figure shows equilibrium at the industry and firm level.Figure 10.6
 In the figure,
S1, S2, S3 are the market supply curves.D1 and D2 are the market demand curves.MC is the marginal cost curve of the firm.MR1 and MR2 are the marginal revenue curves of the firm.ATC is the average-total-cost curve of the firm.
-Since a firm is willing to sell its product at the marginal cost and since the firm receives the market price, the difference between the two is:
A) consumer surplus.
B) economic profit.
C) marginal revenue.
D) producer surplus.
E) a shortage.
Correct Answer:
Verified
Q92: The following figure shows equilibrium at the
Q93: The following figure shows equilibrium at the
Q94: The following figure shows equilibrium at the
Q95: The figure given below shows the revenue
Q96: The following figure shows equilibrium at the
Q98: The following figure shows equilibrium at the
Q99: The following figure shows equilibrium at the
Q100: The figure given below shows the revenue
Q101: The figure given below shows the aggregate
Q102: The figure given below shows the aggregate
Unlock this Answer For Free Now!
View this answer and more for free by performing one of the following actions

Scan the QR code to install the App and get 2 free unlocks

Unlock quizzes for free by uploading documents