The figure given below shows the aggregate demand and supply curves of a perfectly competitive market. Figure 9.7 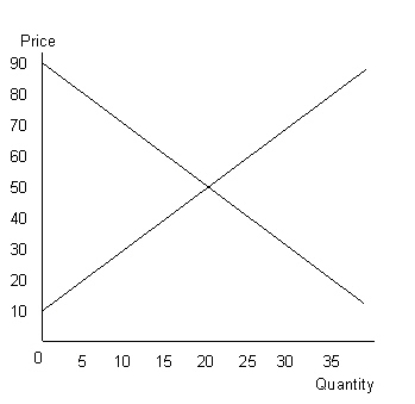
- Refer to Figure 9.7 and calculate the consumer surplus.
A) $200
B) $600
C) $400
D) $800
E) $500
Correct Answer:
Verified
Q101: The figure given below shows the aggregate
Q104: The following figure shows equilibrium at the
Q107: The figure given below shows the aggregate
Q114: When the perfectly competitive firm's demand curve
Q116: The figure given below shows the aggregate
Q120: A perfectly competitive firm faces the downward
Q123: The figure given below shows the aggregate
Q126: The figure given below shows the aggregate
Q128: The figure given below shows the aggregate
Q135: The figure given below shows the aggregate
Unlock this Answer For Free Now!
View this answer and more for free by performing one of the following actions

Scan the QR code to install the App and get 2 free unlocks

Unlock quizzes for free by uploading documents