The following graph shows the marginal revenue (MR) and marginal cost (MC) curves of an imperfectly competitive firm. Figure 8.2 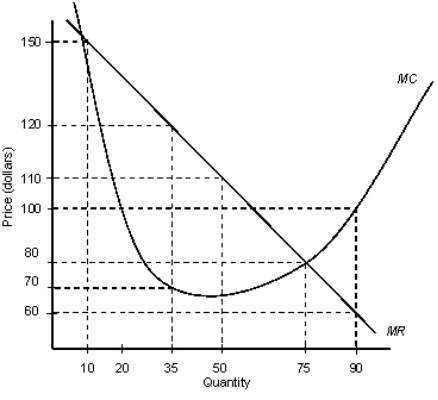
-Refer to Figure 8.2.At a quantity of 10 the firm should _____ ,but at a quantity of 75 the firm should _____.
A) leave production unchanged; also leave production unchanged
B) leave production unchanged; decrease production
C) increase production; decrease production
D) increase production; leave production unchanged
E) decrease production; increase production
Correct Answer:
Verified
Q27: The following graph shows the marginal revenue
Q28: If a firm's marginal revenue is greater
Q29: Suppose that Cheapo Industries,a perfectly competitive firm,currently
Q30: The following graph shows the demand and
Q32: The table given below reports the marginal
Q34: Graphically,total revenue is represented by the:
A)triangle formed
Q35: Profit of a firm is maximized when:
A)marginal
Q36: The following graph shows the demand and
Q37: The table given below reports the marginal
Q37: The following graph shows the demand and
Unlock this Answer For Free Now!
View this answer and more for free by performing one of the following actions

Scan the QR code to install the App and get 2 free unlocks

Unlock quizzes for free by uploading documents