The figure given below shows the cost curves of a firm. Figure 8.3 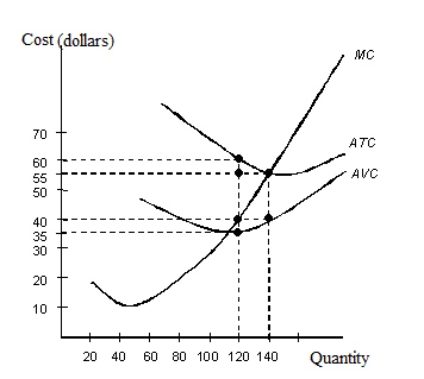
ATC: Average Total Cost
AVC: Average Variable Cost
MC: Marginal Cost
-In Figure 8.3,what is the total cost of producing 140 units of the output?
A) $40
B) $55
C) $300
D) $5,600
E) $7,700
Correct Answer:
Verified
Q46: The figure given below shows the cost
Q47: The figure given below shows the cost
Q47: The figure given below shows the revenue
Q49: The figure given below shows the revenue
Q51: Identify the characteristics of a monopoly firm.
A)Barred
Q52: Which of the following is not true
Q53: A(n) _ is a price taker.
A)monopolistic firm.
B)oligopoly
Q53: The figure given below shows the revenue
Q55: The figure given below shows the revenue
Q55: If barriers to entry exist in a
Unlock this Answer For Free Now!
View this answer and more for free by performing one of the following actions

Scan the QR code to install the App and get 2 free unlocks

Unlock quizzes for free by uploading documents