The below figure shows the various combinations of the goods X and Y that yield different levels of utility. Figure 6.3 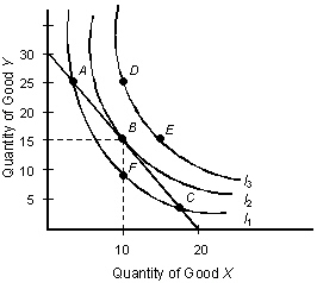
- Refer to Figure 6.3.The consumer prefers _____ to _____.
A) A; C
B) B; A
C) B; D
D) D; E
E) I1; I2
Correct Answer:
Verified
Q92: The table below shows the total utility
Q93: The table below shows the total utility
Q96: The table below shows the total utility
Q96: The below indifference map shows the various
Q99: The below indifference map shows the various
Q105: The below indifference map shows the various
Q106: The below figure shows the various combinations
Q108: The below figure shows the various combinations
Q111: The below indifference map shows the various
Q118: The below figure shows the various combinations
Unlock this Answer For Free Now!
View this answer and more for free by performing one of the following actions

Scan the QR code to install the App and get 2 free unlocks

Unlock quizzes for free by uploading documents