The table given below reports the quantity of bread loaves demanded and supplied at different per unit prices.
Table 3.3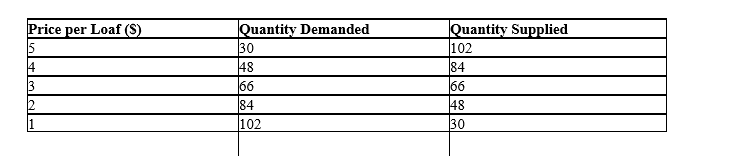
-According to Table 3.3,equilibrium in the market for bread occurs at the price of:
A) $2 per unit
B) $3 per unit
C) $4 per unit
D) $4.5 per unit
E) $1.5 per unit
Correct Answer:
Verified
Q21: The table given below reports the quantity
Q43: The figure given below shows the demand
Q44: The figure given below shows the demand
Q51: In the figure given below D1 and
Q52: The table given below represents the supply
Q54: The output level that occurs in any
Q58: A rightward shift of a market supply
Q59: The relationship between prices and the corresponding
Q60: The table given below reports the quantity
Q72: The below figure shows the demand and
Unlock this Answer For Free Now!
View this answer and more for free by performing one of the following actions

Scan the QR code to install the App and get 2 free unlocks

Unlock quizzes for free by uploading documents