The figure given below represents the production possibilities curve for goods and services in an economy.
Figure 2.3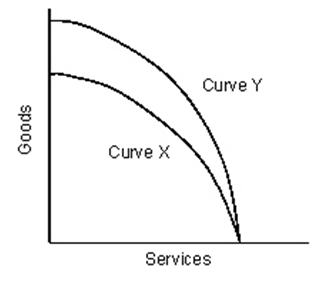
-Refer to Figure 2.3.The movement from Curve X to Curve Y indicates:
A) contraction in the production of goods.
B) contraction in the production of services.
C) expansion in the ability to produce both goods and services.
D) expansion in the ability to produce goods.
E) expansion in the ability to produce services.
Correct Answer:
Verified
Q21: Given below is the production possibilities schedule
Q25: The figure given below represents an economy
Q28: Given below is the production possibilities schedule
Q29: Marginal opportunity cost refers to the:
A)amount of
Q30: Given below is the production possibilities schedule
Q31: A point outside the production possibilities curve
Q33: If society begins by producing 3 units
Q36: Which of the following ideas is illustrated
Q38: Following is the production possibilities schedule for
Q39: The figure given below represents an economy
Unlock this Answer For Free Now!
View this answer and more for free by performing one of the following actions

Scan the QR code to install the App and get 2 free unlocks

Unlock quizzes for free by uploading documents