The table given below represents the output per hour of cookies and chilies in Ohio and Iowa. Table 2.4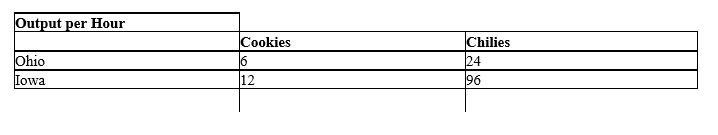
-Refer to Table 2.4.Calculate the opportunity cost of a cookie in Iowa.
A) 8 chilies
B) 4 chilies
C) 96 chilies
D) Less than in Ohio
E) The same as in Ohio
Correct Answer:
Verified
Q42: The table given below represents the output
Q43: The table given below represents the output
Q43: Given below is the production possibilities schedule
Q44: A bowed-out production possibilities curve [PPC] implies
Q46: The table given below represents the output
Q49: The table given below represents the output
Q51: The table given below represents the output
Q52: The table given below represents the output
Q56: Given below is the production possibilities schedule
Q58: The table given below represents the output
Unlock this Answer For Free Now!
View this answer and more for free by performing one of the following actions

Scan the QR code to install the App and get 2 free unlocks

Unlock quizzes for free by uploading documents