The table given below represents the output per hour of cookies and chilies in Ohio and Iowa.
Table 2.4 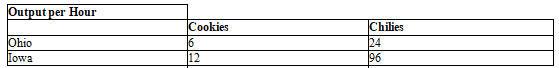
-Refer to Table 2.4.If trade were to occur,what would be the most Ohio would be willing to pay for 1 chili?
A) 4 cookies
B) 8 cookies
C) 1/4 Of a cookie
D) 1/8 Of a cookie
E) 6 cookies
Correct Answer:
Verified
Q41: The table given below represents the output
Q55: The table given below represents butter and
Q56: The table given below represents the output
Q57: If a nation specializes in activities in
Q59: The table given below represents the output
Q59: The table given below represents butter and
Q60: Consider the production possibilities curve [PPC] for
Q62: The figure given below represents the PPC
Q63: Which of the following statements is true
Q67: The figure given below represents the PPC
Unlock this Answer For Free Now!
View this answer and more for free by performing one of the following actions

Scan the QR code to install the App and get 2 free unlocks

Unlock quizzes for free by uploading documents