Multiple Choice
Figure 4-8
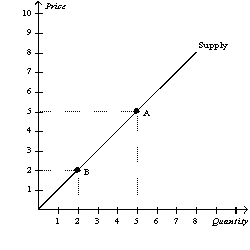
-Refer to Figure 4-8.The movement from Point A to Point B represents a(n)
A) increase in the price.
B) decrease in the quantity supplied.
C) shift in the supply curve.
D) Both a) and b) are correct.
Correct Answer:
Verified
Related Questions
Q5: Other things equal,when the price of a
Q14: If the price of a good is
Q16: A decrease in quantity supplied
A)results in a
Q35: The difference between a supply schedule and
Q142: For teenagers,a 10 percent increase in the
Q144: The belief that tobacco is a "gateway
Unlock this Answer For Free Now!
View this answer and more for free by performing one of the following actions

Scan the QR code to install the App and get 2 free unlocks

Unlock quizzes for free by uploading documents