Figure 4-9
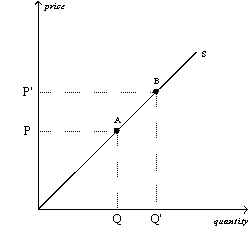
-Refer to Figure 4-9.The movement from point A to point B on the graph is caused by
A) a decrease in the price of the good.
B) an increase in the price of the good.
C) an advance in production technology.
D) a decrease in input prices.
Correct Answer:
Verified
Q18: Which of these statements best represents the
Q21: Which of the following is not held
Q22: A leftward shift of a supply curve
Q29: The supply curve for a good is
Q33: A supply curve slopes upward because
A)as more
Q214: Which of the following demonstrates the law
Q216: Figure 4-9 Q217: An increase in the price of oranges Q220: Figure 4-8 Q221: Figure 4-10 Unlock this Answer For Free Now! View this answer and more for free by performing one of the following actions Scan the QR code to install the App and get 2 free unlocks Unlock quizzes for free by uploading documents
![]()
![]()
![]()

