Table 7-6
-Refer to Table 7-6. You are selling extra tickets to the Midwest Regional Sweet 16 game in the men's NCAA basketball tournament. The table shows the willingness to pay of the four potential buyers in the market for a ticket to the game. Which of the following graphs represents the market demand curve?
A) 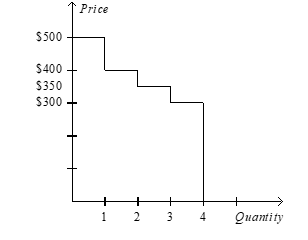
B) 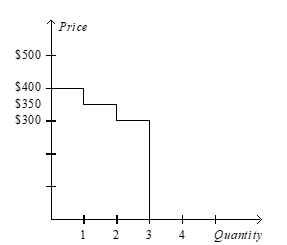
C) 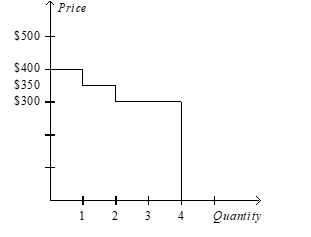
D) 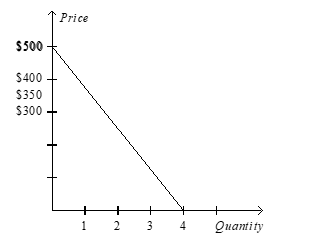
Correct Answer:
Verified
Q23: A drought in California destroys many red
Q27: Chuck would be willing to pay $20
Q28: If a consumer is willing and able
Q29: If a consumer places a value of
Q37: If a consumer places a value of
Q61: Kelly is willing to pay $68 for
Unlock this Answer For Free Now!
View this answer and more for free by performing one of the following actions

Scan the QR code to install the App and get 2 free unlocks

Unlock quizzes for free by uploading documents