Figure 12-1. On the horizontal axis, K/L represents capital (K) per worker (L) . On the vertical axis, Y/L represents output (Y) per worker (L) . 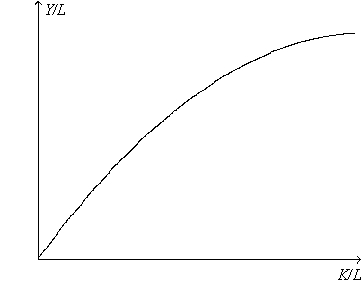
-Refer to Figure 12-1. The curve becomes flatter as the amount of capital per worker increases because of
A) increasing returns to capital.
B) increasing returns to labor.
C) diminishing returns to capital.
D) diminishing returns to labor.
Correct Answer:
Verified
Q21: If a country were to increase its
Q28: Other things the same,a country that increases
Q29: If a country increases its saving rate,which
Q31: In the long run,a higher saving rate
A)cannot
Q33: In the long run,an increase in the
Q34: Other things the same,if a country raises
Q39: In the long run,a higher saving rate
A)cannot
Q230: Figure 12-1. On the horizontal axis, K/L
Q232: If a country increases its saving rate
Q236: All else equal, by saving more, a
Unlock this Answer For Free Now!
View this answer and more for free by performing one of the following actions

Scan the QR code to install the App and get 2 free unlocks

Unlock quizzes for free by uploading documents