Figure 13-1. The figure depicts a demand-for-loanable-funds curve and two supply-of-loanable-funds curves. 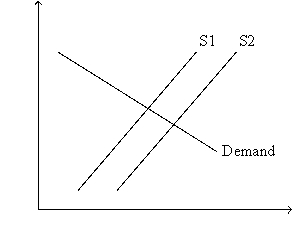
-Refer to Figure 13-1. What is measured along the vertical axis of the graph?
A) the nominal interest rate
B) the real interest rate
C) the quantity of investment
D) the quantity of saving
Correct Answer:
Verified
Q94: If the government instituted an investment tax
Q114: Which of the following are effects of
Q207: Suppose the government changed the tax laws,
Q370: Figure 13-1. The figure depicts a demand-for-loanable-funds
Q371: Figure 13-3. The figure shows two demand-for-loanable-funds
Q372: Figure 13-3. The figure shows two demand-for-loanable-funds
Q374: Figure 13-3. The figure shows two demand-for-loanable-funds
Q377: Figure 13-2. The figure depicts a supply-of-loanable-funds
Q378: Figure 13-3. The figure shows two demand-for-loanable-funds
Q385: If the budget deficit increases then
A) saving
Unlock this Answer For Free Now!
View this answer and more for free by performing one of the following actions

Scan the QR code to install the App and get 2 free unlocks

Unlock quizzes for free by uploading documents