Figure 13-4. On the horizontal axis of the graph, L represents the quantity of loanable funds in billions of dollars. 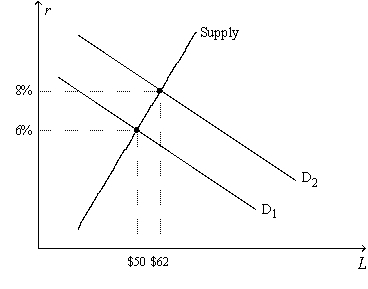
-Refer to Figure 13-4. Which of the following events could explain a shift of the demand-for-loanable-funds curve from to ?
A) The tax code is reformed to encourage greater saving.
B) The tax code is reformed to encourage greater investment.
C) The government starts running a budget deficit.
D) The government starts running a budget surplus.
Correct Answer:
Verified
Q121: For an imaginary economy,when the real interest
Q122: If the quantity of loanable funds demanded
Q125: In which case would people desire to
Q128: When the government goes from running a
Q132: Suppose in some country that the first
Q140: As real interest rates fall,firms desire to
A)buy
Q384: Figure 13-4. On the horizontal axis of
Q386: Figure 13-4. On the horizontal axis of
Q391: Figure 13-4. On the horizontal axis of
Q392: Which of the following could explain an
Unlock this Answer For Free Now!
View this answer and more for free by performing one of the following actions

Scan the QR code to install the App and get 2 free unlocks

Unlock quizzes for free by uploading documents