Figure 17-2. On the graph, MS represents the money supply and MD represents money demand. The usual quantities are measured along the axes. 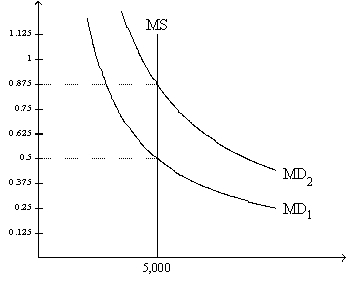
-Refer to Figure 17-2. If the relevant money-demand curve is the one labeled MD1, then
A) when the money market is in equilibrium, one dollar purchases one-half of a basket of goods and services.
B) when the money market is in equilibrium, one unit of goods and services sells for 2 dollars.
C) there is an excess demand for money if the value of money in terms of goods and services is 0.375.
D) All of the above are correct.
Correct Answer:
Verified
Q81: Economic variables whose values are measured in
Q95: Figure 17-1 Q96: Figure 17-2. On the graph, MS represents Q97: Figure 17-3. On the graph, MS represents Q99: Figure 17-2. On the graph, MS represents Q105: You find that to attract a sufficient Q115: When shopping you notice that a pair Q116: Suppose ice cream cones costs $3.Molly holds Q130: The idea that nominal variables are heavily Q152: The price level is a![]()
A)relative variable.
B)dichotomous variable
C)real
Unlock this Answer For Free Now!
View this answer and more for free by performing one of the following actions

Scan the QR code to install the App and get 2 free unlocks

Unlock quizzes for free by uploading documents