Figure 21-4. On the figure, MS represents money supply and MD represents money demand. 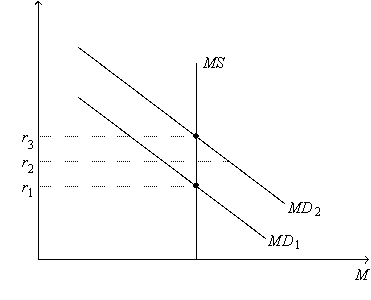
-Refer to Figure 21-4. Which of the following events could explain a decrease in the equilibrium interest rate from r3 to r1?
A) a decrease in the price level
B) a decrease in the number of firms building new factories and buying new equipment
C) an increase in the price level
D) an increase in the number of firms building new factories and buying new equipment
Correct Answer:
Verified
Q166: Charisse is of the opinion that the
Q169: When the interest rate is above the
Q172: Figure 21-4. On the figure, MS represents
Q175: Figure 21-4. On the figure, MS represents
Q180: Figure 21-4. On the figure, MS represents
Q181: Consider the following sequence of events:
Q183: "Monetary policy can be described either in
Q192: The interest rate that the Federal Reserve
Q194: In response to the sharp decline in
Q195: In response to the sharp decline in
Unlock this Answer For Free Now!
View this answer and more for free by performing one of the following actions

Scan the QR code to install the App and get 2 free unlocks

Unlock quizzes for free by uploading documents