Exhibit 10-6 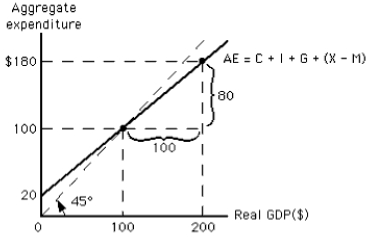
-According to the graph in Exhibit 10-6, if the price level decreases, the new equilibrium level of real GDP must be
A) less than $20
B) less than $100
C) unchanged
D) greater than $100
E) greater than $200
Correct Answer:
Verified
Q83: The aggregate demand curve illustrates a relationship
Q88: An increase in the price level will
A)shift
Q93: In a model with neither income taxes
Q96: We can use an aggregate expenditure line
Q98: What is the effect of an increase
Q99: The aggregate demand curve slopes downward to
Q100: In the simple aggregate expenditures model,planned investment
Q108: The loss of jobs as a result
Q109: What is the effect of an increase
Q116: Exhibit 10-6 ![]()
Unlock this Answer For Free Now!
View this answer and more for free by performing one of the following actions

Scan the QR code to install the App and get 2 free unlocks

Unlock quizzes for free by uploading documents