Exhibit 11-10 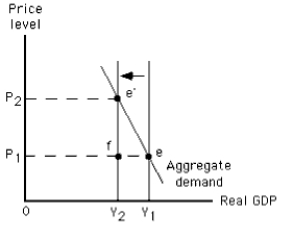
-The graph in Exhibit 11-10 shows a(n)
A) increase in long-run aggregate supply
B) increase in short-run aggregate supply
C) decrease in short-run aggregate supply
D) decrease in long-run aggregate supply
E) increase in aggregate quantity demanded
Correct Answer:
Verified
Q111: Given the aggregate demand curve,an increase in
Q166: Given the aggregate demand curve,a beneficial supply
Q184: Floods in the Midwest that diminish farm
Q185: If global pollution causes climatic changes that
Q187: Throughout the 1990s,
A)unemployment rates were higher in
Q187: An adverse supply shock would shift the
A)short-run
Q189: Given the aggregate demand curve,an adverse supply
Q193: Suppose the economy is initially in long-run
Q198: Which of the following would cause the
Q199: The main effect of a decrease in
Unlock this Answer For Free Now!
View this answer and more for free by performing one of the following actions

Scan the QR code to install the App and get 2 free unlocks

Unlock quizzes for free by uploading documents