Refer to the figure below. Moving from demand curve D1 to demand curve D2 illustrates a(n) : 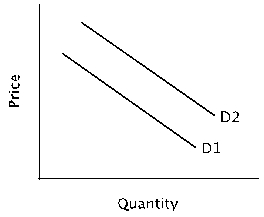
A) increase in quantity demanded.
B) increase in demand.
C) decrease in demand.
D) decrease in quantity demanded.
Correct Answer:
Verified
Q86: If fast food is an inferior good
Q87: Suppose one observes that when the price
Q93: At the beginning of the fall semester,
Q94: Refer to the figure below. Suppose the
Q96: Refer to the figure below. Suppose the
Q99: Refer to the figure below. Suppose the
Q100: Suppose that a disease that affects people
Q101: Refer to the table below. Suppose the
Q102: Refer to the table below. Relative to
Q114: Which of the following would cause an
Unlock this Answer For Free Now!
View this answer and more for free by performing one of the following actions

Scan the QR code to install the App and get 2 free unlocks

Unlock quizzes for free by uploading documents