The following table provides data for an economy in a certain year. 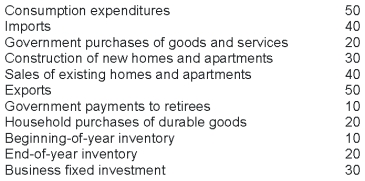 Given the data in the table, how much did households spend on nondurables and services?
A) 20
B) 30
C) 50
D) 70
Correct Answer:
Verified
Q81: In which of the following situations would
Q83: The government purchases component of GDP includes:
A)purchases
Q84: Net exports equal:
A)the value added of exports.
B)exports
Q85: If business inventories equal $40 billion at
Q89: Which of the following would increase the
Q91: Which of the following would increase the
Q91: The following table provides data for an
Q97: The following table provides data for an
Q99: The following table provides data for an
Q120: Capital income in the U.S.equals approximately _
Unlock this Answer For Free Now!
View this answer and more for free by performing one of the following actions

Scan the QR code to install the App and get 2 free unlocks

Unlock quizzes for free by uploading documents