Figure 2.3 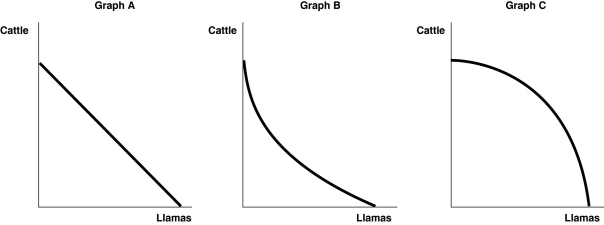 Alt text for Figure 2.3: In figure 2.3, 3 graphs, A, B and C comparing production of cattle and llamas.
Long description for Figure 2.3: Graph A: the x-axis is labelled, llamas, and y-axis is labelled, cattle.A line slopes down from the top left corner of the quadrant, near the top of the y-axis to the bottom right corner, near the end of the x-axis.Graph B: the x-axis is labelled, llamas, and y-axis is labelled, cattle.A convex curve begins in the top left corner, near the top of the y-axis and ends in the bottom right corner, near the end of the x-axis.Graph C: the x-axis is labelled, llamas, and y-axis is labelled, cattle.A concave curve begins in the top left corner near the top of the y-axis, and ends in the bottom right corner, near the end of the x-axis.
-Refer to Figure 2.3.Sergio Vignetto raises cattle and llamas on his land.Half the land is more suitable for raising cattle and half the land is better suited for raising llamas.Which of the graphs in Figure 2.3 represent his production possibilities frontier?
A) Graph A
B) Graph B
C) Graph C
D) either Graph A or Graph C
E) either Graph B or Graph C
Correct Answer:
Verified
Q25: Table 2-1
Production choices for Tomaso's Trattoria
Q25: Economic decline (negative growth)is represented on a
Q28: _ opportunity cost implies that as more
Q30: Table 2-1
Production choices for Tomaso's Trattoria
Q31: Which of the following would shift a
Q33: Table 2-1
Production choices for Tomaso's Trattoria
Q37: The slope of a production possibilities frontier
A)has
Q45: Figure 2-4 Q57: Without an increase in the supplies of Q58: Figure 2-4 ![]()
![]()
Unlock this Answer For Free Now!
View this answer and more for free by performing one of the following actions

Scan the QR code to install the App and get 2 free unlocks

Unlock quizzes for free by uploading documents