Figure 2-4 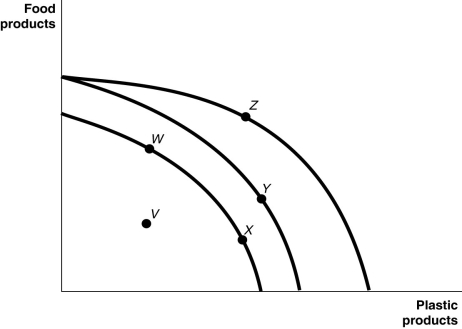 Figure 2-4 shows various points on three different production possibilities frontiers for a nation.
-Refer to Figure 2-4. Consider the following movements:
a. from point V to point W
b. from point W to point Y
c. from point Y to point Z
Which of the movements listed above represents economic growth?
A) a, b, and c
B) b and c only
C) a only
D) b only
Correct Answer:
Verified
Q25: Economic decline (negative growth)is represented on a
Q41: Figure 2-4 Q41: Figure 2-4 Q45: Figure 2-4 Q46: Figure 2-4 Q46: Figure 2-4 Q47: Figure 2-4 Q48: Which of the following would shift a Q57: Figure 2-4 Q59: Figure 2-4 Unlock this Answer For Free Now! View this answer and more for free by performing one of the following actions Scan the QR code to install the App and get 2 free unlocks Unlock quizzes for free by uploading documents
![]()
![]()
![]()
![]()
![]()
![]()
![]()
![]()

