Figure 2.7 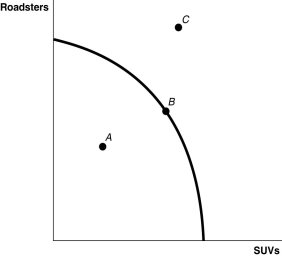 Alt text for Figure 2.7: In figure 2.7, a graph compares production possibility frontiers of S U Vs and Roadsters.
Long description for Figure 2.7: The x-axis is labelled, S U Vs, and the y-axis is labelled, Roadsters.A convex curve begins near the top of the y-axis and ends approximately 3 quarters of the way down the x-axis.The point B is plotted midway along the curve.Point A is plotted between the curve and the y-axis.Point C is plotted outside the curve, near the top of the y-axis and approximately midway along the x-axis.
-Refer to Figure 2.7. ________ is (are) inefficient in that not all resources are being used.
A) Point A
B) Point B
C) Point C
D) Points A and C
Correct Answer:
Verified
Q14: The production possibilities frontier shows
A)the various products
Q47: According to the production possibility model,if more
Q57: Consider a country that produces only two
Q60: Suppose your expenses for this term are
Q60: The Great Depression of the 1930s, with
Q62: The production possibilities frontier model assumes all
Q72: The opportunity cost of taking a semester-long
Q104: a.Draw a production possibilities frontier for a
Q105: What is a production possibilities frontier? What
Q105: The principle of _ is that the
Unlock this Answer For Free Now!
View this answer and more for free by performing one of the following actions

Scan the QR code to install the App and get 2 free unlocks

Unlock quizzes for free by uploading documents