Figure 2.7 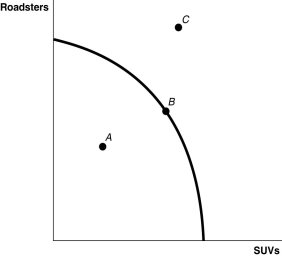 Alt text for Figure 2.7: In figure 2.7, a graph compares production possibility frontiers of S U Vs and Roadsters.
Long description for Figure 2.7: The x-axis is labelled, S U Vs, and the y-axis is labelled, Roadsters.A convex curve begins near the top of the y-axis and ends approximately 3 quarters of the way down the x-axis.The point B is plotted midway along the curve.Point A is plotted between the curve and the y-axis.Point C is plotted outside the curve, near the top of the y-axis and approximately midway along the x-axis.
-Refer to Figure 2.7. ________ is (are) technically efficient.
A) Point A
B) Point B
C) Point C
D) Points B and C
Correct Answer:
Verified
Q2: _ shows that if all resources are
Q8: In a production possibilities frontier model,a point
Q20: The _ production points on a production
Q71: An increase in the labour force shifts
Q75: To increase fuel efficiency, automobile manufacturers make
Q77: Governments do not face trade-offs in providing
Q81: Increasing marginal opportunity cost implies that
A)the more
Q83: Susan can perform either a combination of
Q104: The unattainable points in a production possibilities
Q166: Figure 2-11 ![]()
Unlock this Answer For Free Now!
View this answer and more for free by performing one of the following actions

Scan the QR code to install the App and get 2 free unlocks

Unlock quizzes for free by uploading documents