Figure 2.8 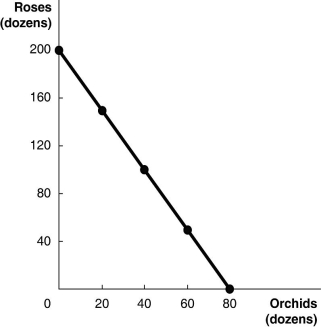 Figure 2.8 above shows the production possibilities frontier for Vidalia, a nation that produces two goods, roses and orchids.
Alt text for Figure 2.8: In figure 2.8, a graph illustrates the production possibilities frontier for roses and orchids in Vidalia.
Long description for Figure 2.8: The x-axis is labelled, orchids, in dozens, and is marked from 0 to 80 in increments of 20.The y-axis is labelled, roses, in dozens, and is marked from 0 to 200 in increments of 40.Five points (0, 200) , (20, 150) , (40, 100) , (60, 50) , and (80, 0) are plotted on the graph and joined to form a line, which slants from the top left corner and slopes down to the bottom right corner.
-Refer to Figure 2.8.Suppose Vidalia receives orders for 60 dozen orchids and 120 dozen roses. Vidalia will
A) not be able to produce enough to fill the order.
B) make a lot of extra money.
C) be using its resources inefficiently if it fills the order.
D) experience economic growth if it fills the order.
Correct Answer:
Verified
Q23: The slope of a production possibilities frontier
Q27: Increasing opportunity cost along a bowed-out production
Q33: A production possibilities frontier with a _
Q40: If opportunity costs are _,the production possibilities
Q88: Figure 2.9 Q89: Figure 2-8 Q90: What is the opportunity cost of a Q93: Table 2.3 Q100: Table 2-3 Q106: Figure 2-8 Unlock this Answer For Free Now! View this answer and more for free by performing one of the following actions Scan the QR code to install the App and get 2 free unlocks Unlock quizzes for free by uploading documents![]()
![]()
Production Choices for Dina's Diner
Production Choices for Dina's Diner
![]()

