Figure 2.9 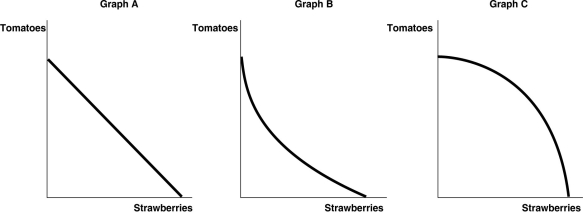 Alt text for Figure 2.9: In figure 2.9, 3 graphs, A, B, and C depict production possibilities frontier for Carlos Vanya.
Long description for Figure 2.9: Graph A: The x-axis is labelled, strawberries, and the y-axis is labelled, tomatoes.A line slopes from the top left corner of the quadrant, near the end of the y-axis, down to the bottom right corner, near the end of the x-axis.Graph B: The x-axis is labelled, strawberries, and the y-axis is labelled, tomatoes.A concave curve begins in the top left corner of the quadrant, near the top of the y-axis, and ends near the end of the y-axis.Graph C: The x-axis is labelled, strawberries, and the y-axis is labelled, tomatoes.A convex curve begins in the top left corner, near the top of the y-axis, and ends in the bottom right corner, near the end of the y-axis.
-Refer to Figure 2.9.Carlos Vanya grows tomatoes and strawberries on his land.A portion of his land is more suitable for growing tomatoes and the other portion is better suited for strawberry cultivation.Which of the graphs in Figure 2.9 represent his production possibilities frontier?
A) Graph A
B) Graph B
C) Graph C
D) either Graph A or Graph B
E) either Graph B or Graph C
Correct Answer:
Verified
Q23: The slope of a production possibilities frontier
Q33: A production possibilities frontier with a _
Q40: If opportunity costs are _,the production possibilities
Q83: Susan can perform either a combination of
Q89: Figure 2-8 Q89: Figure 2.8 Q90: What is the opportunity cost of a Q93: Table 2.3 Q100: Table 2-3 Q106: Figure 2-8 Unlock this Answer For Free Now! View this answer and more for free by performing one of the following actions Scan the QR code to install the App and get 2 free unlocks Unlock quizzes for free by uploading documents![]()
![]()
Production Choices for Dina's Diner
Production Choices for Dina's Diner
![]()

