Figure 2.11 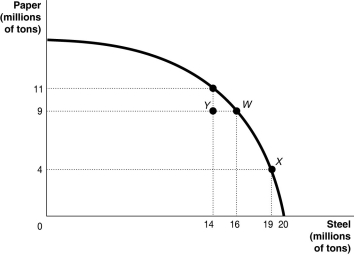 Alt text for Figure 2.11: In figure 2.11, a graph compares paper and steel production.
Long description for Figure 2.11: The x-axis is labelled, steel in millions of tons and the quantities 14, 16, 19, and 20 are marked.The y-axis is labelled, paper in millions of tons, and the quantities 4, 9, and 11 are marked.Points Y(14, 9) , W(16, 9) , (19, 4) , and an unnamed point (14, 11) are plotted on the graph, and joined to the respective axes using dotted lines.A concave curve is drawn from the y-axis to the x-axis, passing through the unnamed point (14, 11) , and points W(16, 9) , and X(19, 4) .Point Y is between the curve and the axes.
-Refer to Figure 2.11.If the economy is currently producing at point X, what is the opportunity cost of moving to point W?
A) 3 million tons of steel
B) 19 million tons of steel
C) 5 million tons of paper
D) 9 million tons of paper
Correct Answer:
Verified
Q78: The opportunity cost of taking an on-line
Q97: An increase in population shifts the production
Q115: The recession of 2008-2009 would most likely
Q116: An outward shift of a nation's production
Q117: According to the production possibility model, if
Q118: Figure 2.10 Q119: Figure 2.11 Q121: To increase fuel efficiency, automobile manufacturers make Q123: Figure 2.12 Q125: Table 2.4 Unlock this Answer For Free Now! View this answer and more for free by performing one of the following actions Scan the QR code to install the App and get 2 free unlocks Unlock quizzes for free by uploading documents![]()
![]()
![]()
![]()

