Figure 2.12 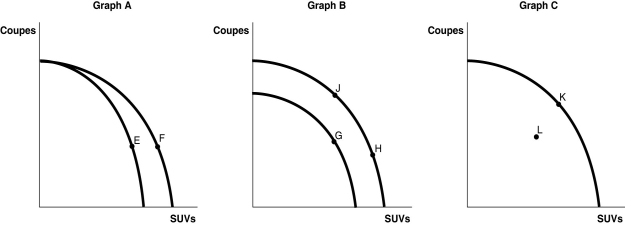 Tesla motors currently has three different models available in Canada; the Model S and the Model 3 (both coupes) and the Model X (an SUV) .Figure 2.12 shows changes to its production possibilities frontier in response to new developments and different strategic production decisions.
Alt text for Figure 2.12: In figure 2.12, 3 graphs, A, B and C show changes to Tesla motors' production possibilities frontier.
Long description for Figure 2.12: Graph A: The x-axis is labelled, S U Vs, and the y-axis is labelled, coupes.2 convex curves begin from the same point near the top of the y-axis.The curves diverge.The first curve ends a little more than half-way along the x-axis.The point E is plotted a little more than half-way along the curve.The second curve ends further along the x-axis, near the end of the axis.The point F is plotted a little more than half-way along the curve.Graph B: The x-axis is labelled, S U Vs, and the y-axis is labelled, coupes.2 convex curves are shown.The first curve begins approximately 3 fifths of the way up the y-axis and finishes a little more than half way along the x-axis.Point G is plotted a little more than half-way along the curve.The second curve begins near the end of the y-axis, and ends close to the end of the x-axis.Point J is plotted is little more than 1 third of the way along the curve, and point H is plotted 3 quarters of the way along the curve.
-Refer to Figure 2.12.Suppose worker productivity increases so that the total number of vehicles produced increases as the company adds more machinery and workers and changes the layout of the factory.This is best represented by the
A) movement from E to F in Graph A.
B) movement from G to H in Graph B.
C) movement from K to L in Graph C.
D) movement from J to H in Graph B.
Correct Answer:
Verified
Q64: An increase in the unemployment rate may
Q79: If a country is producing efficiently and
Q93: If additional units of a good could
Q97: Consider a country that produces only two
Q97: An increase in population shifts the production

