Figure 2.13 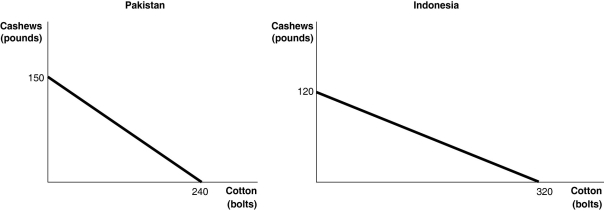 Figure 2.13 shows the production possibilities frontiers for Pakistan and Indonesia.Each country produces two goods, cotton and cashews.
Alt text for Figure 2.13: In figure 2.13, 2 graphs, show the production possibilities frontiers for Pakistan and Indonesia.
Long description for Figure 2.13: The graph on the left represents Pakistan.The x-axis is labelled, cotton in bolts, and the amount 240 marked.The y-axis is labelled, cashews in pounds, and the amount 150 is marked .A slanted line is drawn from point 150 on the y-axis to point 240 on the x-axis.The graph on the right represents Indonesia.The x-axis is labelled, cotton, in bolts, and the amount 320 is marked.The y-axis is labelled, cashews, in pounds, and the amount 120 marked.A slanted line is drawn from point 120 on the y-axis to point 320 on the x-axis.
-Refer to Figure 2.13.Which country has a comparative advantage in the production of cashews?
A) Indonesia
B) They have equal productive abilities.
C) Pakistan
D) neither country
Correct Answer:
Verified

