Figure 2.13 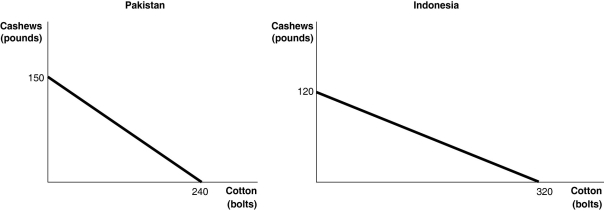 Figure 2.13 shows the production possibilities frontiers for Pakistan and Indonesia.Each country produces two goods, cotton and cashews.
Alt text for Figure 2.13: In figure 2.13, 2 graphs, show the production possibilities frontiers for Pakistan and Indonesia.
Long description for Figure 2.13: The graph on the left represents Pakistan.The x-axis is labelled, cotton in bolts, and the amount 240 marked.The y-axis is labelled, cashews in pounds, and the amount 150 is marked .A slanted line is drawn from point 150 on the y-axis to point 240 on the x-axis.The graph on the right represents Indonesia.The x-axis is labelled, cotton, in bolts, and the amount 320 is marked.The y-axis is labelled, cashews, in pounds, and the amount 120 marked.A slanted line is drawn from point 120 on the y-axis to point 320 on the x-axis.
-Refer to Figure 2.13.If the two countries have the same amount of resources and the same technological knowledge, which country has an absolute advantage in the production of cotton?
A) Indonesia
B) They have the same advantage.
C) Pakistan
D) cannot be determined
Correct Answer:
Verified
Q86: What does the term "increasing marginal opportunity
Q87: Any output combination inside a production possibility
Q106: You have an absolute advantage whenever you
A)are
Q111: Comparative advantage means the ability to produce
Q121: Which of the following statements is true?
A)Individuals
Q137: If the price of a good or

