Figure 3.1 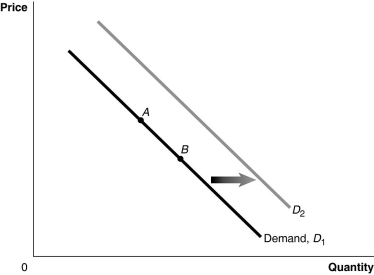 Alt text for Figure 3.1: In figure 3.1, graph of the effect of an increase in population on the demand curve.
Long description for Figure 3.1: The x-axis is labelled, Quantity, and y-axis is labelled, Price.Curve Demand, D1, is a straight line which slopes down from the top left corner to the bottom right corner.Curve D2 follows the same slope as curve D1, but is plotted to the right.2 points, A and B, are plotted in the middle of curve D1.A right pointing arrow indicates the change from curve D1 to curve D2.
-Refer to Figure 3.1.A case in which consumers no longer cared for a product would be represented by a movement from
A) A to B.
B) B to A.
C) D1 to D2.
D) D2 to D1.
Correct Answer:
Verified
Q4: The _ effect refers to the change
Q19: Table 3.1 Q20: If Red Bull and Beaver Buzz Energy Q22: Which of the following products would be Q22: Technological advances have resulted in lower prices Q26: Suppose that when the price of hamburgers Q27: As incomes in Alberta fall people are Q28: Buyers rush to purchase stocks in Ontario Q38: Elvira decreased her consumption of bananas when Q44: Technological advancements have led to lower prices![]()
Unlock this Answer For Free Now!
View this answer and more for free by performing one of the following actions

Scan the QR code to install the App and get 2 free unlocks

Unlock quizzes for free by uploading documents