Figure 3.4 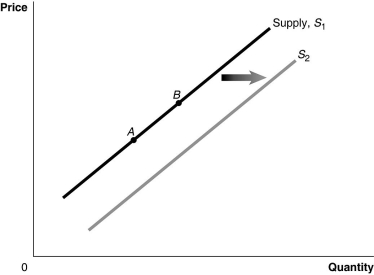 Alt text for Figure 3.4: In figure 3.4, a graph of the effect of technological advancement on supply curve.
Long description for Figure 3.4: The x-axis is labelled, Quantity, and the y-axis is labelled, Price.Curve Supply, S1, is a straight line which slopes up from the bottom left corner to the top right corner.2 points, A and B, are marked in the middle of curve S1.Curve S2 follows the same slope as curve S1, but is plotted to the right.A right pointing arrow indicates the change from curve S1 to curve S2.
-Refer to Figure 3.4.An increase in the expected future price of the product would be represented by a movement from
A) A to B.
B) B to A.
C) S1 to S2.
D) S2 to S1.
Correct Answer:
Verified
Q99: One would speak of a movement along
Q100: In July,market analysts predict that the price
Q114: Quantity supplied refers to the amount of
Q116: The supply curve for umbrellas
A)shows the supply
Q141: Farmers can plant either wheat or lentils
Q142: A firm has an incentive to decrease
Unlock this Answer For Free Now!
View this answer and more for free by performing one of the following actions

Scan the QR code to install the App and get 2 free unlocks

Unlock quizzes for free by uploading documents