Figure 3.6 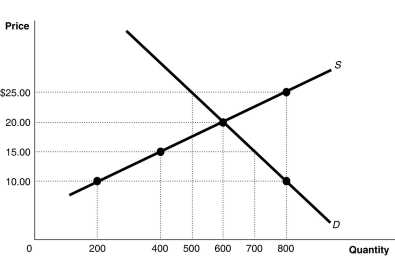 Alt text for Figure 3.6: In figure 3.6, a graph of intersecting supply and demand curves illustrates shortage and surplus in a market, along with its equilibrium.
Long description for Figure 3.6: The x-axis is labelled, Quantity, with the values 0, 200, 400, 500, 600, 700 and 800 marked.The y-axis is labelled, Price, with the values 0, 10.00, 15.00, 20.00 and 25.00 dollars marked.Curve Supply S is a straight line which slopes up from the bottom left corner to the top right corner.4 points are plotted along the curve; (200, 10) , (400, 15) , (600, 20) , and (800, 25) .Demand curve D is a straight line which slopes down from the top left corner to the bottom right corner.Curve D intersects the S curve at (600, 20) , and passes through another point, (800, 10) .All plotted points are connected to the corresponding values on the x and y-axis with dotted lines.
-Refer to Figure 3.6.At a price of $10, how many units will be sold?
A) 200
B) 400
C) 600
D) 800
Correct Answer:
Verified
Q121: Would a change in the price of
Q125: At a product's equilibrium price
A)the product's demand
Q175: Figure 3.6 Q176: When all else equal, as the price Q177: Figure 3.8 Q178: Figure 3.6 Q181: In the spring of 2016 there was Q183: Currently, China buys more than 40% of Q184: Figure 3.10 Q286: Figure 3-6 Unlock this Answer For Free Now! View this answer and more for free by performing one of the following actions Scan the QR code to install the App and get 2 free unlocks Unlock quizzes for free by uploading documents![]()
![]()
![]()
![]()
![]()

