Figure 3.8 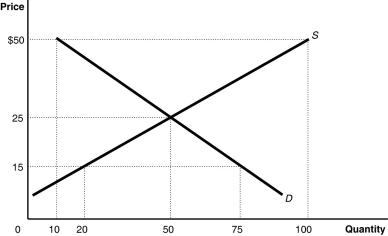 Alt text for Figure 3.8: In figure 3.8, a graph plotting intersecting supply and demand curves represents the market for canvas tote bags.
Long description for Figure 3.8: The x-axis is labelled, Quantity, with the values 0, 10, 20, 50, 75, and 100 marked.The y-axis is labelled, Price, with the values 0, 15, 25, and 50 dollars marked.Curve D is a straight line which slopes down from the top left corner to the bottom right corner.Curve S is a straight line which begins in the bottom left corner and slopes up to the top right corner.The equilibrium of the 2 curves is (50,25) .The point plotted on curve S to the left of equilibrium is (20,15) .The point plotted on curve D to the right of point of equilibrium is (75,15) .The point plotted to the right of equilibrium on curve S is (100,50) .The point plotted to the right of the equilibrium on curve D is (10,50) .
-Refer to Figure 3.8.The figure above represents the market for canvas tote bags.Assume that the market price is $35.Which of the following statements is true?
A) There is a surplus that will cause the price to decrease; quantity demanded will then increase and quantity supplied will decrease until the price equals $25.
B) There is a surplus that will cause the price to decrease; quantity supplied will then increase and quantity demanded will decrease until the price equals $25.
C) There will be a surplus that will cause the price to decrease; demand will then increase and supply will decrease until the price equals $25.
D) There is a surplus that will cause the price to increase; quantity demanded will then decrease and quantity supplied will increase until the price equals $25.
Correct Answer:
Verified

