Multiple Choice
Table 5.9 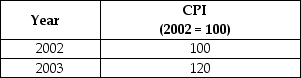
-Refer to Table 5.9.Suppose that the data in the table above reflect the price levels in the economy.What is the inflation rate in between 2002 and 2003?
A) 2%
B) 5%
C) 10%
D) 12%
E) 20%
Correct Answer:
Verified
Related Questions
Q182: Why does the substitution bias cause the
Q185: Which of the following is the smallest
Q186: If the CPI changes from 125 to
Q187: Most economists believe that biases cause changes
Q189: Cashmere socks cost 35 cents a pair
Q192: The broadest measure of the price level
Q193: The CPI is also referred to as
A)the
Unlock this Answer For Free Now!
View this answer and more for free by performing one of the following actions

Scan the QR code to install the App and get 2 free unlocks

Unlock quizzes for free by uploading documents