Figure 6.1 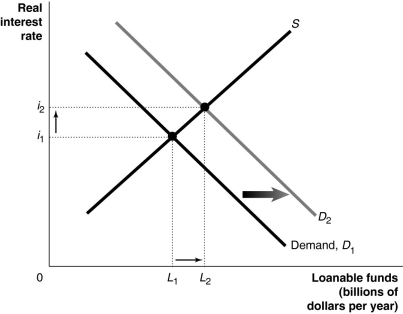 Alt text for Figure 6.1: In figure 6.1, a graph comparing loanable funds and real interest rate.
Long description for Figure 6.1: The x-axis is labelled, loanable funds (billions of dollars per year) , with values L1 and L2 marked.The y-axis is labelled, real interest rate, with values i1 and i2 marked.3 lines are plotted; Demand D1, D2 and S.Line D1 begins at the top left corner and slopes down to centre bottom.Line D2 follows the same slope as D1, but is plotted to the right.The line S begins near the origin and slopes up to the top right corner.The area between lines D1 and D2 is indicated by a right pointing arrow.Line S intersects line D1 at the point (L1, i1) , approximately 3 quarters of the way along both lines.S intersects D2 at the point (L2, i2) approximately 3 quarters of the way along both lines.These points of intersection are connected to the corresponding values on the x-axis and y-axis by dotted lines.Between the dotted lines, a rightward arrow points from L1 toward L2, and another arrow points up from i1 toward i2.
-Refer to Figure 6.1.Which of the following is consistent with the graph depicted above?
A) An expected recession decreases the profitability of new investment.
B) Technological change increases the profitability of new investment.
C) The government runs a budget surplus.
D) Households become spendthrifts and begin to save less.
E) Government making more effort to balance the budget.
Correct Answer:
Verified
Q97: In a closed economy, private saving is
Q98: Which of the following is most liquid?
A)a
Q99: Liquidity refers to
A)the ability to purchase a
Q100: Scenario 6.1
Consider the following data for a
Q101: When the government runs a budget deficit,
Q103: In 2016 the federal government was forecast
Q104: There is a federal budget deficit when
A)the
Unlock this Answer For Free Now!
View this answer and more for free by performing one of the following actions

Scan the QR code to install the App and get 2 free unlocks

Unlock quizzes for free by uploading documents