Figure 6.6 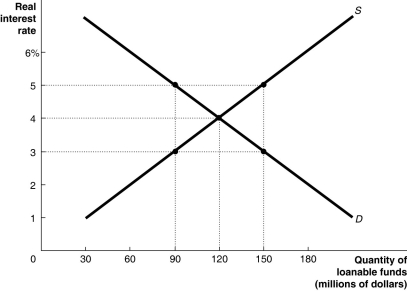 Alt text for Figure 6.6: In figure 6.6, a graph shows loanable funds market in equilibrium.
Long description for Figure 6.6: The x-axis is labelled, quantity of loanable funds (millions of dollars) , ranging from 0 to 180 in increments of 30.The y-axis is labelled real interest rate, ranging from 0 to 6% in increments of 1.2 intersecting lines are shown.A line labelled D begins at the top left corner and slopes down toward the end of the x-axis.Another line labelled S begins near the origin and slopes upward to the top right corner.5 points are plotted on these two lines as (90, 5) , (90, 3) , (120, 4) , (150, 5) , (150, 3) .These points are connected to their respective coordinates on the x-axis and y-axis using dotted lines.
-Refer to Figure 6.6.The loanable funds market is in equilibrium, as shown in the figure above.An increase in the supply of loanable funds could result in which of the following combinations of the real interest rate and quantity of loanable funds at a new equilibrium?
A) The real interest rate is 5 percent, and the quantity of loanable funds is $150 million.
B) The real interest rate is 5 percent, and the quantity of loanable funds is $90 million.
C) The real interest rate is 3 percent, and the quantity of loanable funds is $150 million.
D) The real interest rate is 3 percent, and the quantity of loanable funds is $90 million.
E) The real interest rate is 1 percent and the quantity of loanable funds is $180 million.
Correct Answer:
Verified
Q164: Equilibrium in the loanable funds market determines
A)the
Q165: Which of the following is most likely
Q166: The federal budget deficit can be reduced
Q167: Which of the following is not a
Q168: If technological change increases the profitability of
Q170: Which of the following changes would be
Q171: The demand for loanable funds is determined
Q172: The supply of loanable funds has a
Q173: Figure 6.6 Q174: The budget deficit is defined as![]()
A)T -
Unlock this Answer For Free Now!
View this answer and more for free by performing one of the following actions

Scan the QR code to install the App and get 2 free unlocks

Unlock quizzes for free by uploading documents