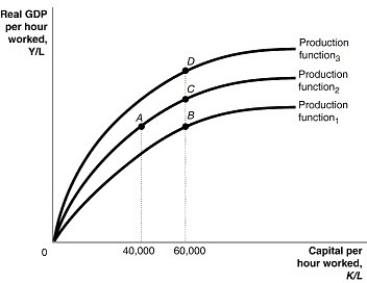
Figure 7.1  Alt text for Figure 7.1: In figure 7.1, a graph comparing capital per hour worked and real GDP per hour worked.
Long description for Figure 7.1: The x-axis is labelled, capital per hour worked, K/L, with values 40,000 and 60,000 marked.The y-axis is labelled, real GDP per hour worked, Y/L, with 0 at the vertex.3 concave curves, each originating from the vertex are shown.4 points A, B, C, and D are plotted such that point A has 40,000 as the x coordinate, and points B, C, and D have 60,000 as the x coordinate.The 3 curves pass through these points.The curve labelled, Production function 1, passes through point B.The curve labelled, Production function 2, passes through points A and C.The curve labelled, Production function 3, passes through point D.
-Refer to Figure 7.1. Which of the following could cause an economy to move from point C to B?
A) Restrictions on foreign direct investment and international migration.
B) Government funding of universities.
C) Policies that encourage firms to adopt new production technology.
D) The introduction of computer coding classes in primary education.
E) An economy gaining more capital.
Correct Answer:
Verified
Q65: Because of diminishing returns, an economy can
Q66: If the per-worker production function shifts down,
A)it
Q67: According to new growth theory
A)physical capital is
Q68: Figure 7.2 Q69: According to new growth theory, Q71: Under the Soviet system of communism, Q72: In a small European country, it is Q73: Why would knowledge capital exhibit increasing returns Q74: Technological improvements are more likely to occur Q75: In a small European country, it is![]()
A)technological change is
A)managerial pay
Unlock this Answer For Free Now!
View this answer and more for free by performing one of the following actions

Scan the QR code to install the App and get 2 free unlocks

Unlock quizzes for free by uploading documents