Figure 7.2 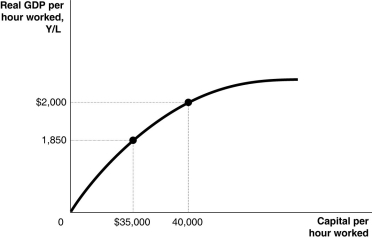 Alt text for Figure 7.2: In figure 7.2, a graph comparing capital per hour worked and real GDP per hour worked.
Long description for Figure 7.2: The x-axis is labelled, capital per hour worked.The y-axis is labelled, real GDP per hour worked, Y/L.A concave curve originates from 0 at the vertex and passes through 2 points ($35,000, 1,850) and (40,000, $2000) , toward the end of the x-axis.These 2 points are connected to their respective coordinates on the x-axis and y-axis with dotted lines.
-Refer to Figure 7.2.Assuming no technological change, if Canada increases capital per hour worked by $40,000 every year between 2015 and 2020, we would expect to see
A) real GDP per hour worked will increase by the same increment each year between 2015 and 2020.
B) real GDP per hour worked will be lower in 2020 than it was in 2015.
C) the per-worker production function will get flatter over time.
D) the per-worker production function will shift up every year there is increase in capital per hour worked.
E) the per worker production function will become steeper every year.
Correct Answer:
Verified
Q59: Suppose that an increase in capital per
Q60: The small group of East Asian countries
Q61: In the eighteenth century, Honoré Blanc, a
Q62: Figure 7.1 Q63: Paul Romer, an economist at Stanford University, Q65: Because of diminishing returns, an economy can Q66: If the per-worker production function shifts down, Q67: According to new growth theory Q68: Figure 7.2 Q69: According to new growth theory,![]()
A)it
A)physical capital is![]()
A)technological change is
Unlock this Answer For Free Now!
View this answer and more for free by performing one of the following actions

Scan the QR code to install the App and get 2 free unlocks

Unlock quizzes for free by uploading documents